Access this project
Demo URL: https://ktqjmz-kazi0shahrukh-omar.shinyapps.io/cs424-project1-kzo/
Introduction video: https://youtu.be/crEsxcrTsXU
GitHub repo: https://github.com/komar41/CS-424-Project-1-kzo
Tools used: R and Shiny.
This project is intended for visualizing the trends and interesting patterns in Chicago 'L' Station ridership data of three CTA stations in Chicago namely: UIC-Halsted, O'Hare, and Sox-35th. UIC–Halsted (formerly Halsted or U of I-Halsted) serves the University of Illinois at Chicago, the University Village neighborhood, and the Greektown neighborhood all located in the Near West Side. O'Hare station is located at O'Hare International Airport. The Sox-35th station is situated at 142 West 35th Street in the Armour Square neighborhood. Currently, the station serves Guaranteed Rate Field, the stadium of the Chicago White Sox, and takes its name from this location.
User Interface
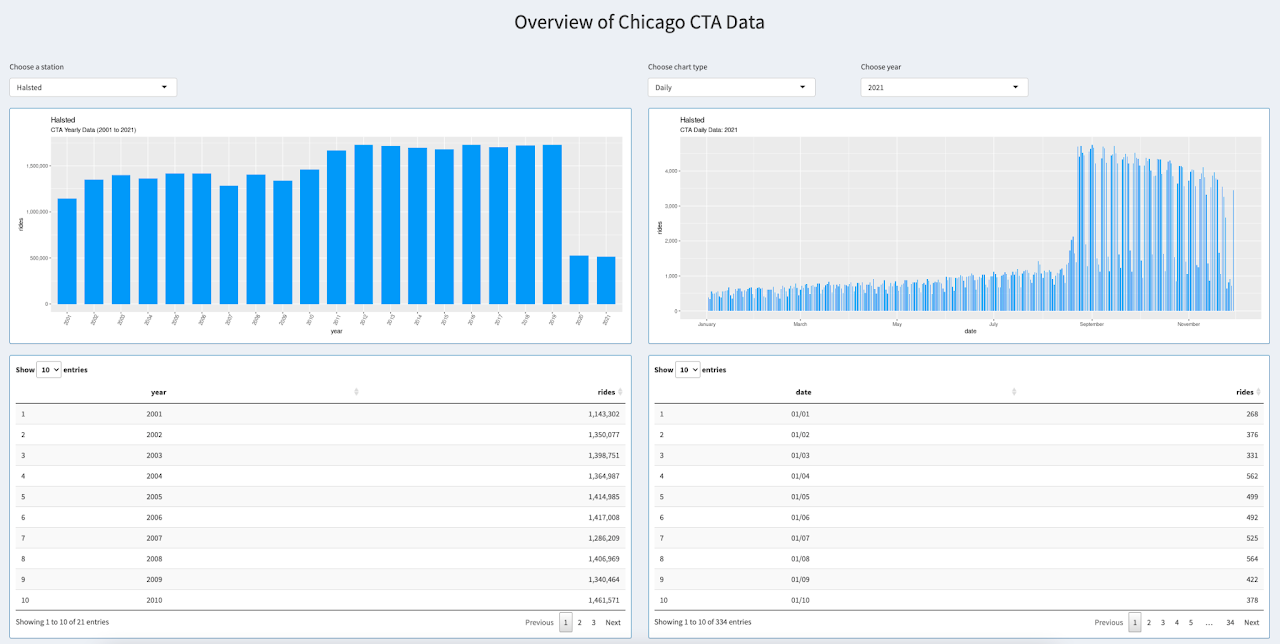
The overview page is to give users an overview of ridership data of the three CTA stations from the year 2001 to 2021. First, users will need to select a particular station. The yearly bar chart on the left will give a general overview of how ridership data in a chosen CTA station changed over the years. On the right side, users can choose between three chart types: daily, monthly, or weekdays. Users also have to select a particular year for which the chart on the right side will be displayed. Users can also see the raw data below each chart.
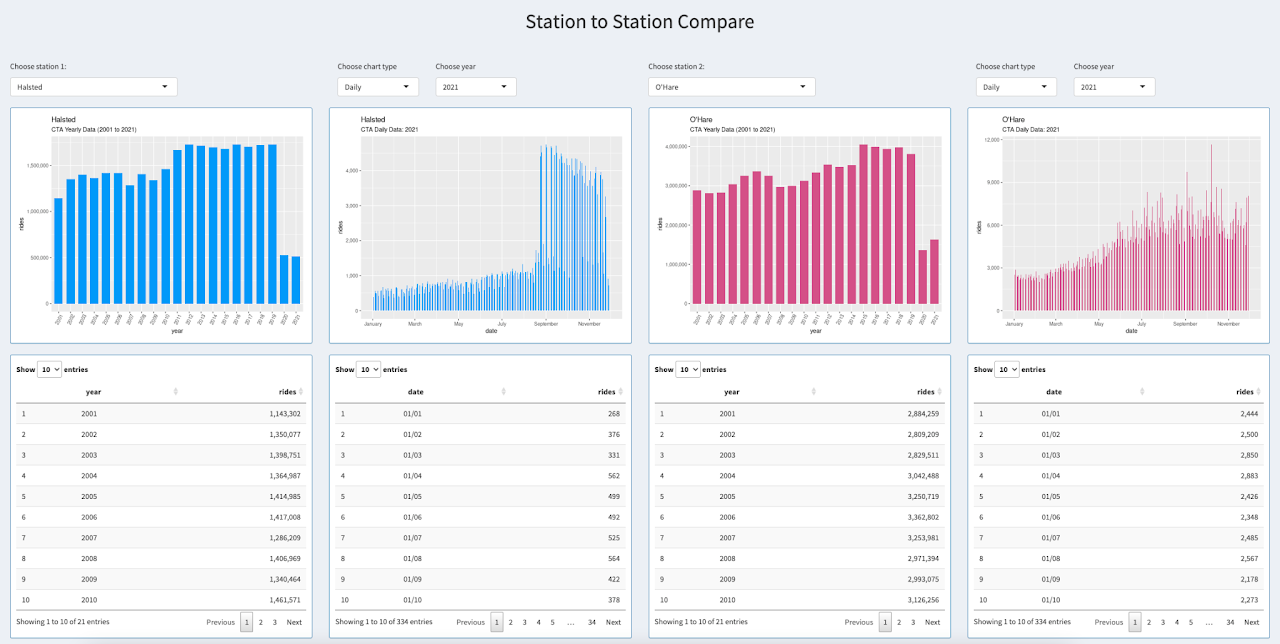
The comparison page gives a quick comparison of ridership data between two stations. Users can select station, chart type, and year filter for charts on both left and right sides. Here also users can see the raw data below each chart.
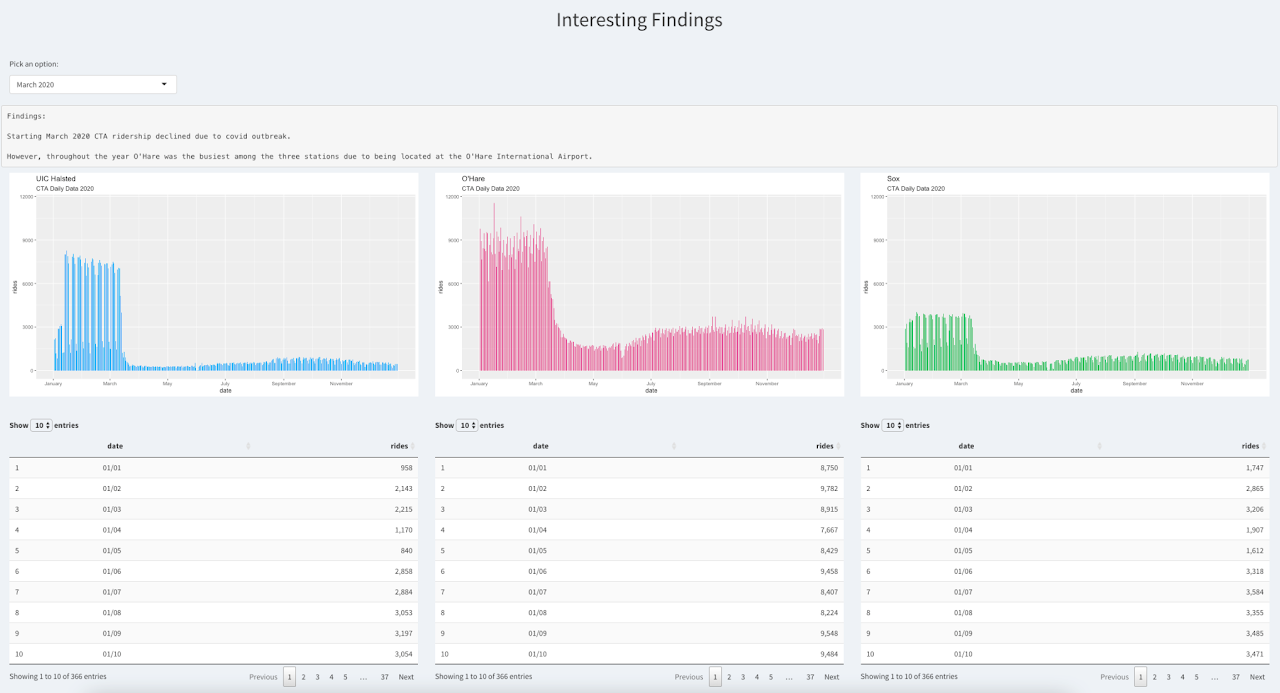
On the interesting findings page, users can choose to see some of the interesting insights found from the ridership data of these three CTA stations. For example, if user picks the option "March 2020", they will see how the CTA ridership declined in all three stations due to the covid outbreak starting March 2020.
About the Data
Data source: Chicago Data Portal. The file size is 39MB.
The original data is very detailed and contains ridership data of all the CTA stations in Chicago starting 2001 to 2021. The dataset shows entries at all turnstiles, combined, for each station. Daytypes are as follows: W = Weekday, A = Saturday, U = Sunday/Holiday.
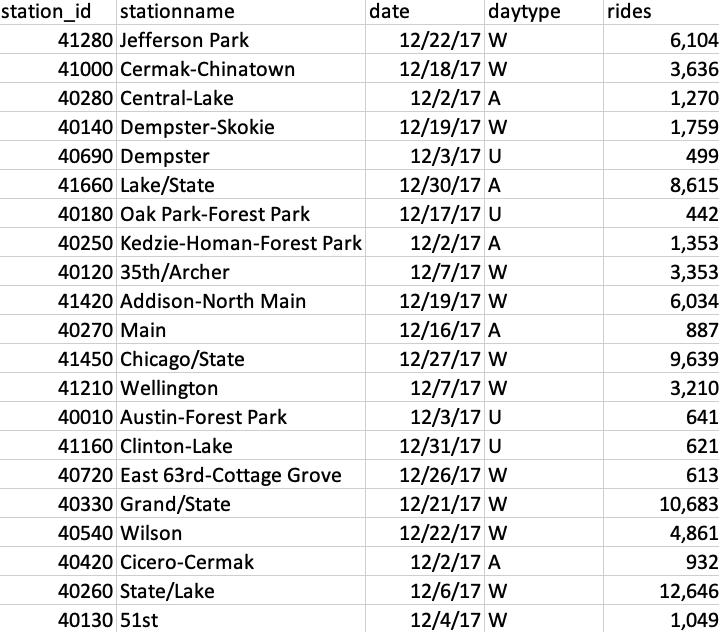
For the purpose of this project, ridership data is filtered for three particular stations namely: UIC-Halsted, O'hare, and Sox-35th. After filtering the data, three separate TSV files were created for each of the stations. Later, these three TSV files were used to create the visualizations of the app. R language was used to read and filter the dataset. The code used for filtering the original dataset and creating the TSV files is provided below:
library(dplyr)

cta <- read.csv(file = "CTA_-_Ridership_-__L__Station_Entries_-_Daily_Totals.tsv", sep = "\t", header = TRUE)

cta_halsted <- cta %>% filter(stationname == "UIC-Halsted")

write.table(cta_halsted, file = "cta_halsted.tsv", row.names=FALSE, sep="\t")

cta_ohare <- cta %>% filter(stationname == "O'Hare Airport")

write.table(cta_ohare, file = "cta_ohare.tsv", row.names=FALSE, sep="\t")

cta_sox <- cta %>% filter(stationname == "Sox-35th-Dan Ryan")

write.table(cta_sox, file = "cta_sox.tsv", row.names=FALSE, sep="\t")
Interesting Findings
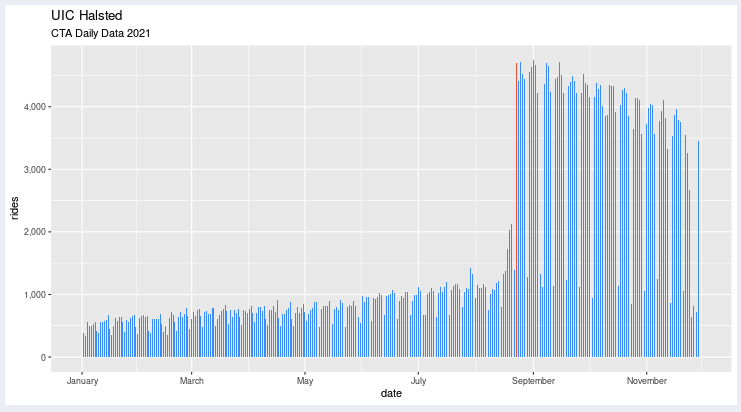
Findings 1: Starting August 23, 2021 UIC reopened for in-person classes for the first time since Covid lockdown restrictions.
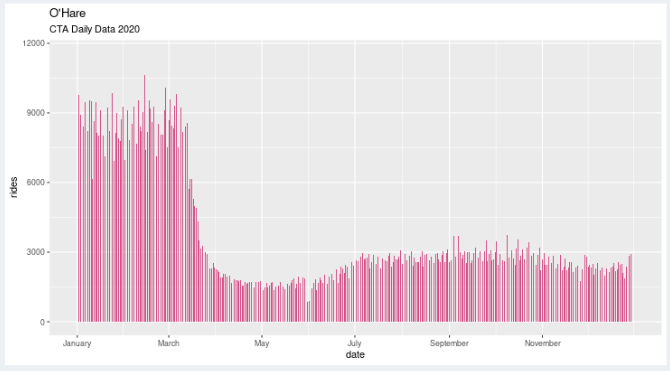
Findings 2: Starting March 2020 CTA ridership declined due to the covid outbreak. However, throughout the year O'Hare was the busiest among the three stations due to being located at the O'Hare International Airport.
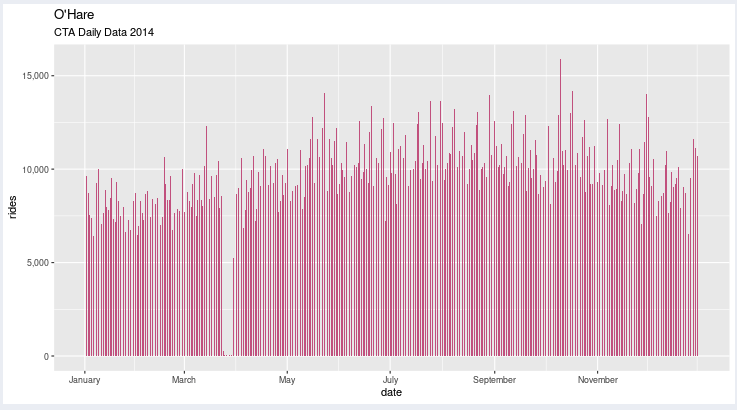
Findings 3: On March 24, 2014 at 2:50 a.m. local time, a CTA passenger train overran the bumper at O'Hare, injuring 34 people. Following the accident, the line between O'Hare and Rosemont was closed, with a replacement bus service in place.
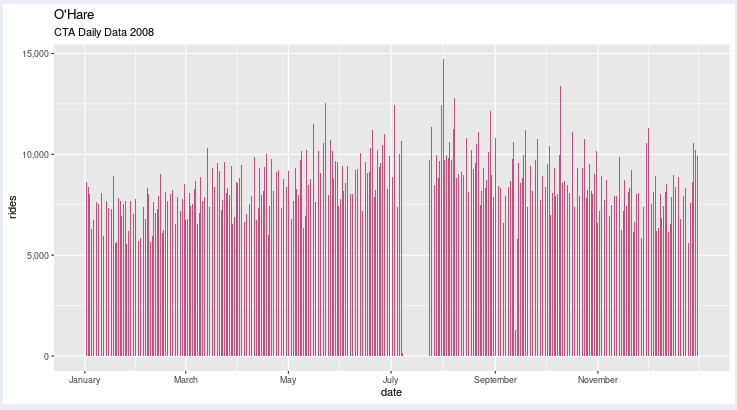
Findings 4: In July 2008, service was suspended on the Blue Line for approximately 3 weeks between the O’Hare and Rosemont stations for construction.
Findings 5: The coldest temperature in Chicago in 34 years (-23°) was recorded on the morning of January 30, 2019 during a bitter cold couple of days. Presumably, UIC remained closed and thus the drop in CTA ridership.
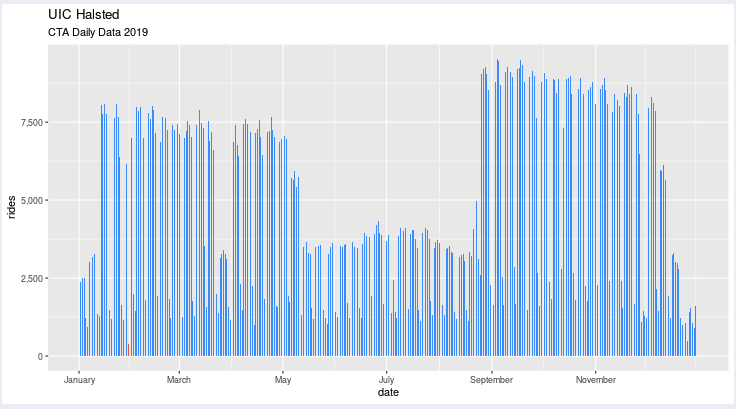
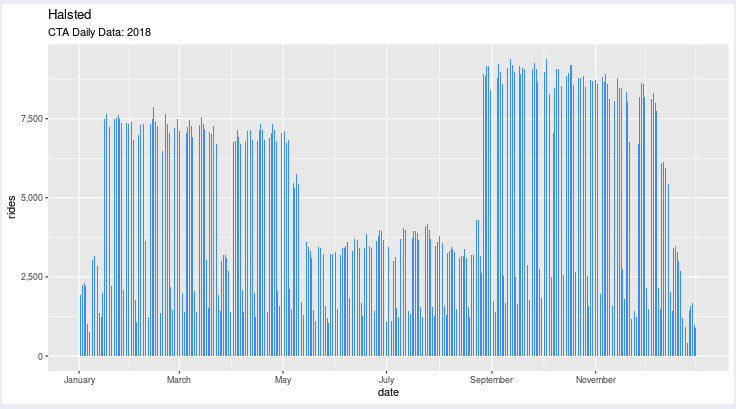
Findings 6: During each year, the lowest ridership recorded at Halsted station is 25th December. (With exception of polar vortex on January 30, 2019 and Covid outbreak in 2020 and 2021)
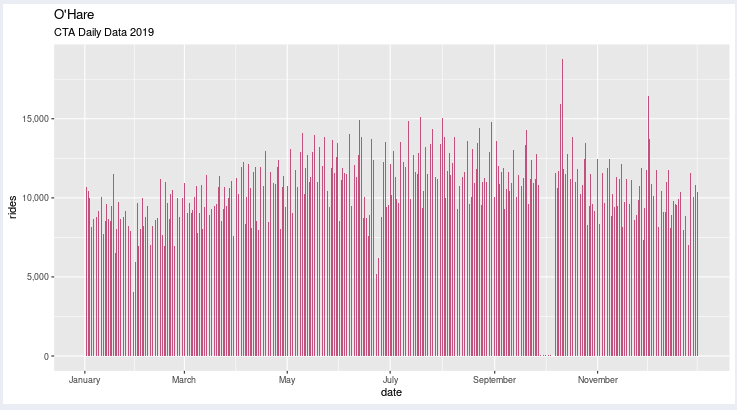
Findings 7: O'Hare station was temporarily closed from Sep 28, 2019 to Oct 6, 2019 due to construction (signal improvements).
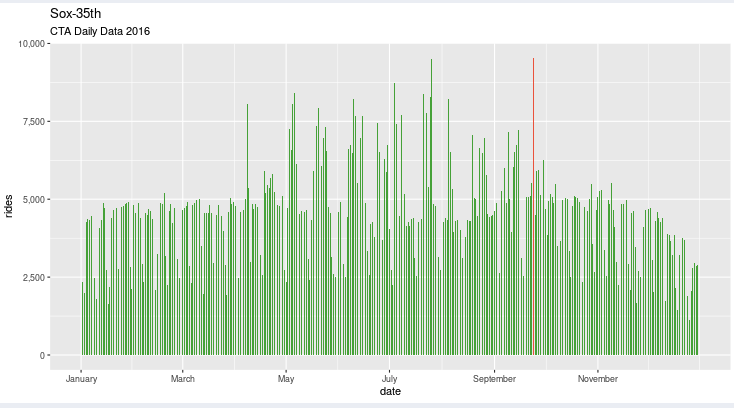
Findings 8: On September 24, 2016, Chicago White Sox stadium had a record attendance of 47,754 hosting a concert of Chance the Rapper.
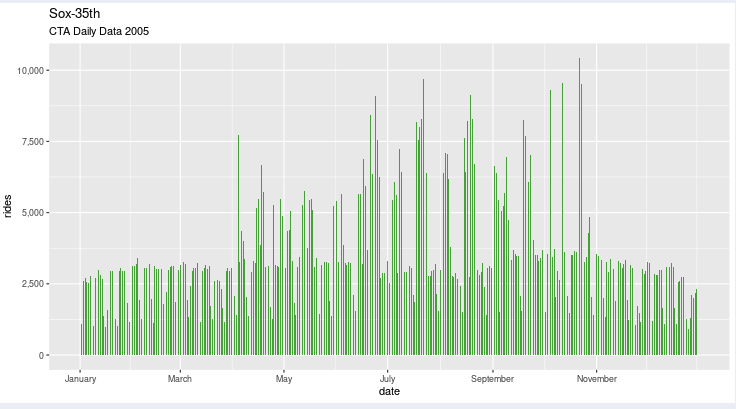
Findings 9: October 22, 2005: The first-ever World Series game in Chicago White Sox stadium. The White Sox get their first World Series game victory since 1959, defeating the Houston Astros 5–3. Attendance: (41,206)
October 23, 2005: The stadium hosted Game 2 of the World Series. The Sox won 7–6. Additionally, The Sox would win the next two games in Houston to win their first World Series title since 1917. Attendance: (41,432)
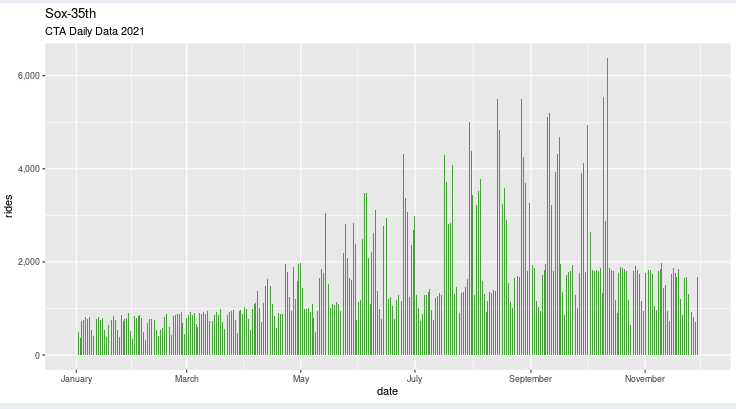
Findings 10: October 10, 2021: Guaranteed Rate Field hosted its first playoff game since 2008 with the White Sox facing the Houston Astros in the ALDS with the Sox trailing 2 games to none. (Attendance: 40,288)
October 12, 2021: Guaranteed Rate Field hosted game 4 of the ALDS between the White Sox and Astros. The Astros won 10-1 and advanced to the ALCS. (Attendance: 40,170)
Setup and Installations
Install R:
Download R from https://www.r-project.org/ (4.1.2). Click “download R”.

You can select the default link https://cloud.r-project.org/.

Download and install a version that match your OS.

Install RStudio:
Download and install RStudio from https://rstudio.com/products/rstudio/.

Download the free version.

Setup the project:
Create a folder in your local machine where you want the project to locate at. Open the terminal and set the direction to the created folder. Run the following command: git clone https://github.com/komar41/Subway.git.

Open RStudio. Go to “File” and select “Open Project”.

Choose the project folder (“Subway”) that you cloned from GitHub.

Open the file “app.R” and press “Run App” button on RStudio.

Rstudio will tell you if you are missing some of the packages. When the pop-up shows up, click “Yes” to install all those packages.

After Installation of those packages, RStudio will start a Shiny app on your local machine.
