Access this project
Demo URL: https://akashmagnadia.shinyapps.io/cs424_p2/
Introduction video: https://youtu.be/VtEGv0v-xSU
GitHub repo: https://github.com/komar41/Dont-Sleep-in-the-Subway
Tools used: Python, R, and Shiny.
The visulization was created for a screen with resolution of 5760x1620 (Sage screen of EVL UIC Lab). [For reference see picture below]
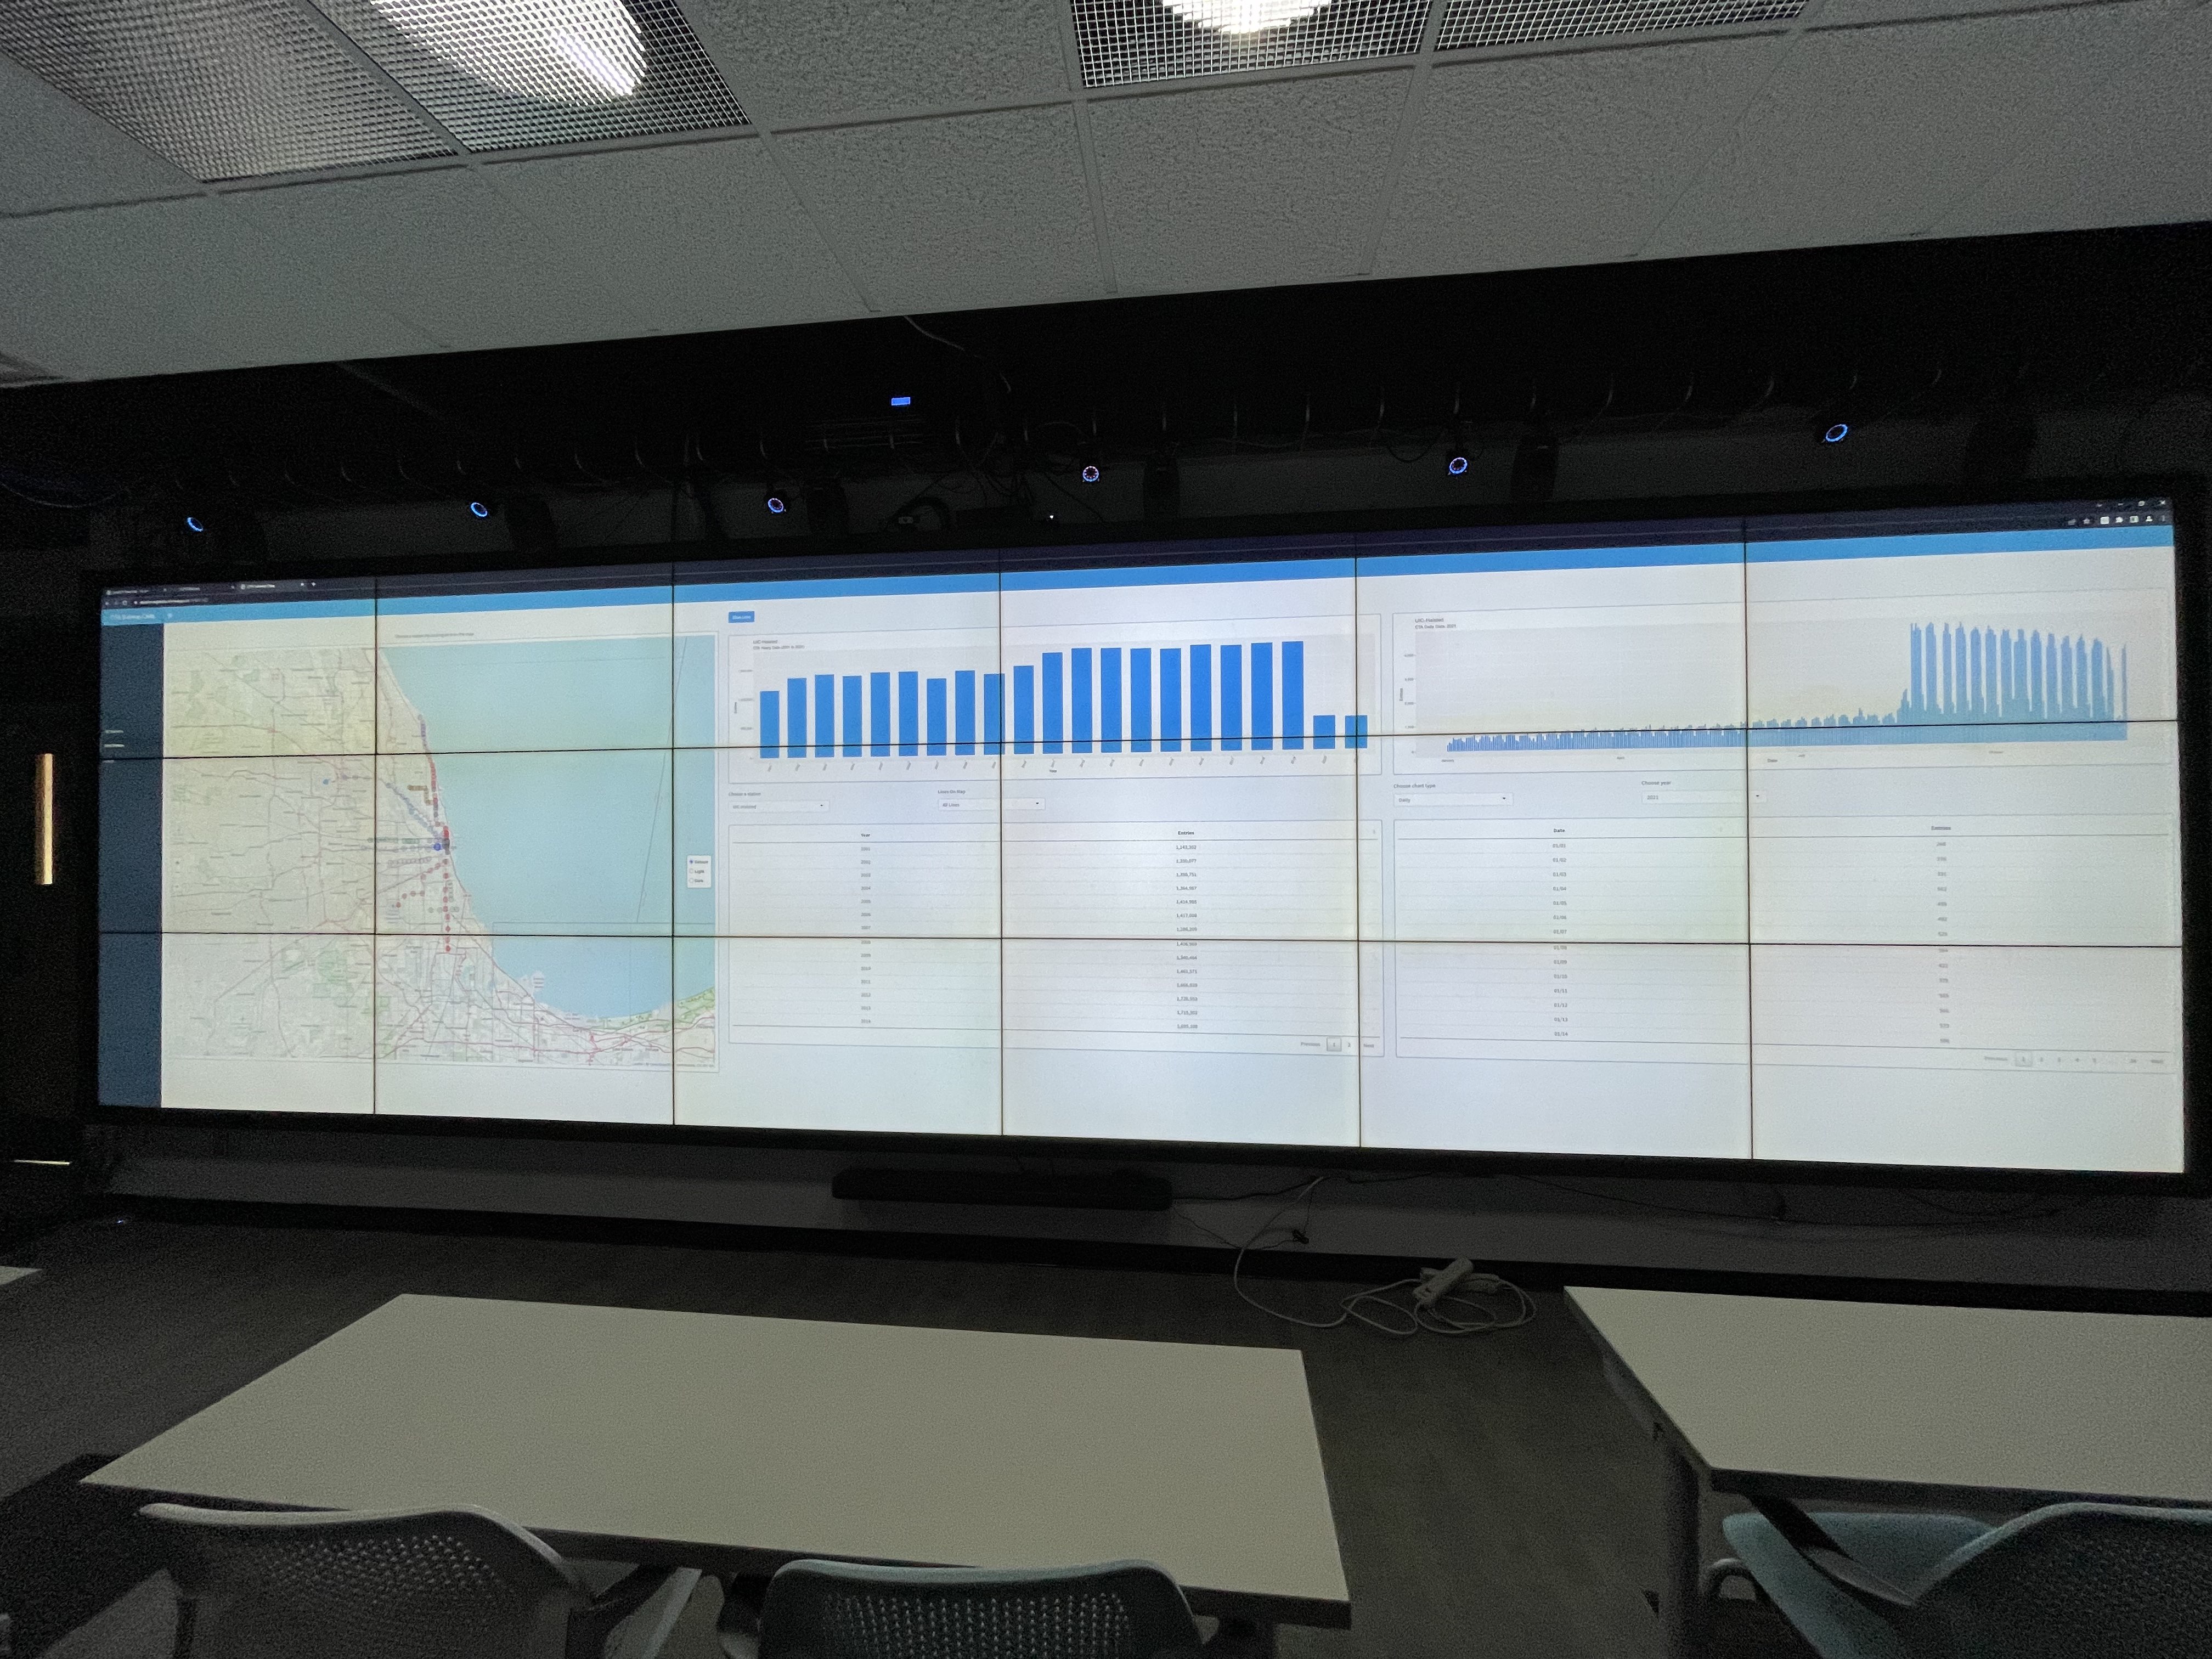
This project is intended for visualizing the geographic information of all the CTA L stations and also to find out the trends and interesting patterns in Chicago 'L' Station ridership data.
User Interface
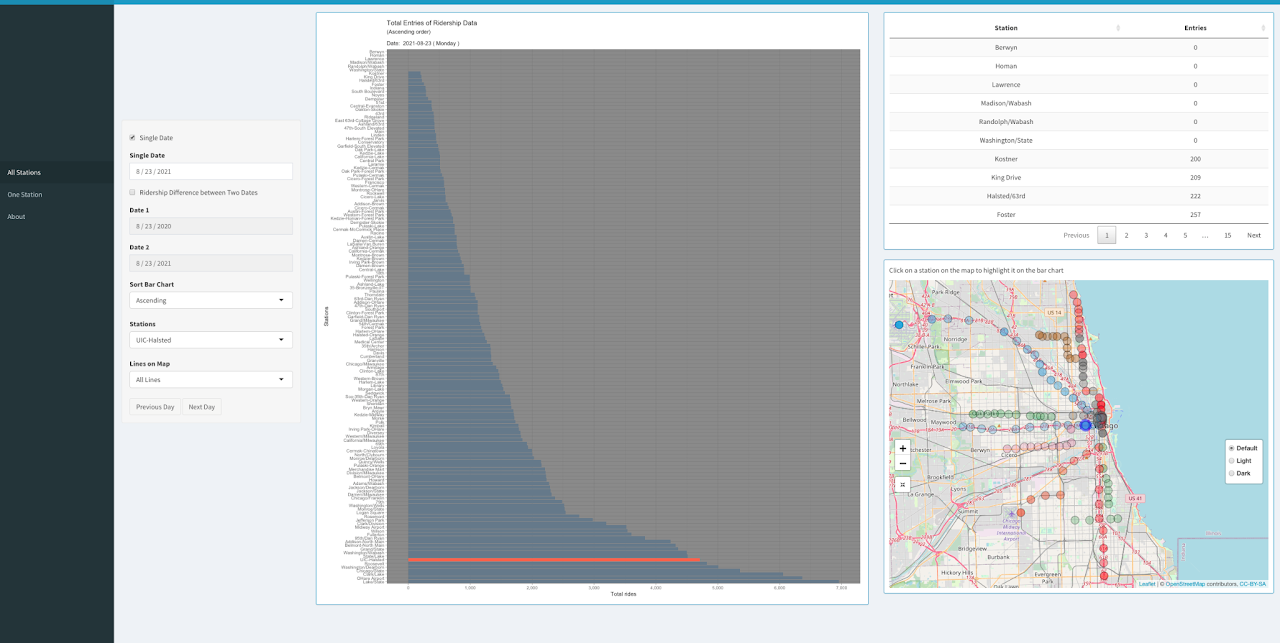
The All Stations page in the application displays total ridership entry of a single date of all the CTA stations. The opacity of the stations on the map changes according to ridership entry. Users can select a particular date using the option "Single Date" on the left side. To highlight a station on the map and on the bar chart, the user can click on that station on the map or use the dropdown menu "Stations" on the left. Users can also choose line colors using the dropdown menu "Lines on Map". Initially "All lines" option is selected. Upon selecting a line color (ie: pink line), the dropdown menu "Stations" will contain only the stations from the chosen line color. The map will also display only those stations from the chosen line color. The bar chart can be sorted in ascending, descending or alphabetic order using the dropdown menu "Sort Bar Chart" and the data table will also be sorted accordingly. Users can easily navigate to previous or next date using the two buttons from bottom-left.
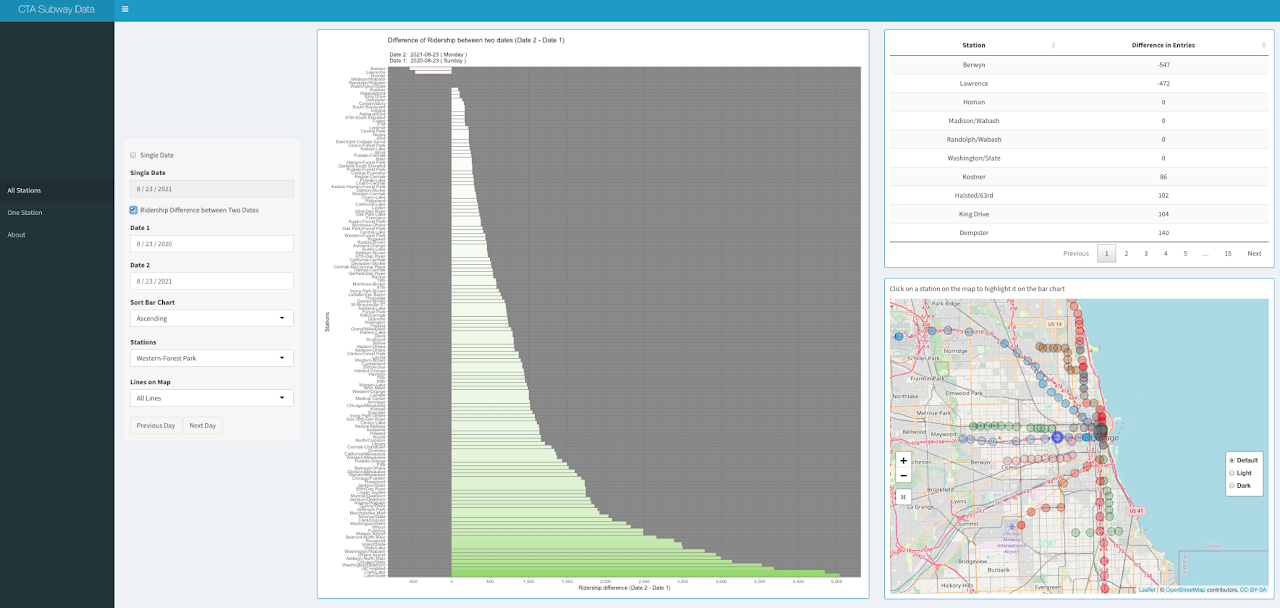
Upon selecting the checkbox "Ridership Difference between Two Dates" in the All Stations page, users will be able to see the change in entries between two selected days (Date 1 and Date 2) in a divergent color scheme on the bar chart. The data table and the map also change accordingly.
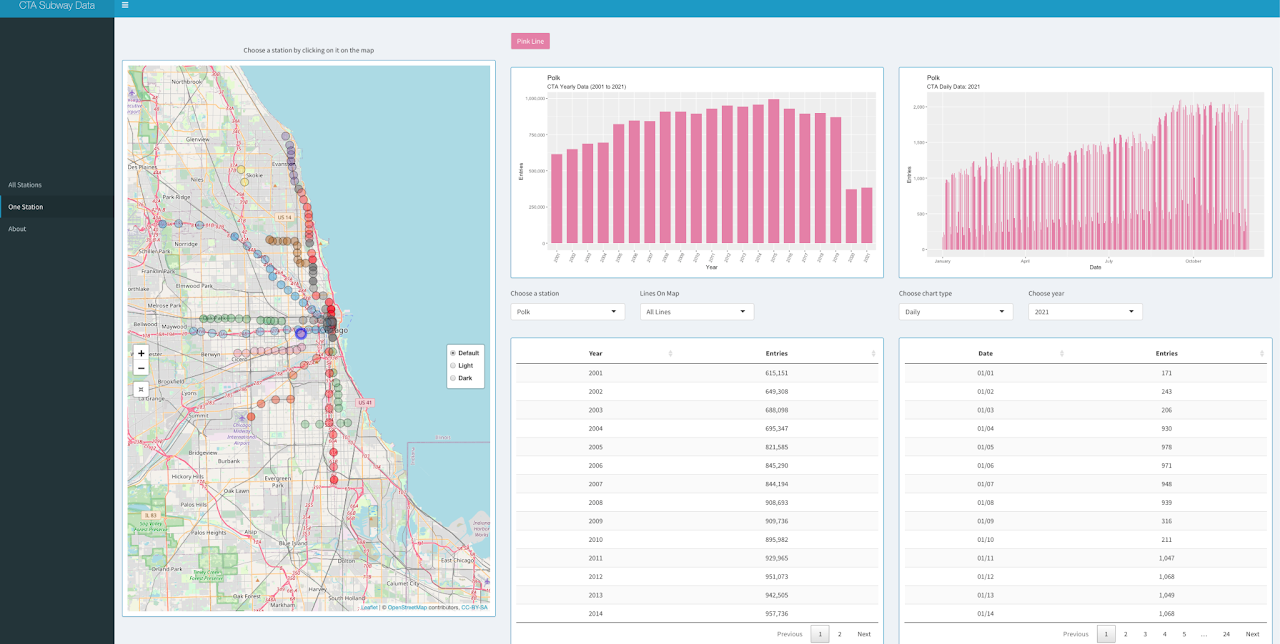
The second page - One Station - gives users an overview of ridership data of a particular CTA station. Users can select a particular station by clicking on it on the map or using the dropdown menu. To narrow down the selection of station, users can choose a line color from the dropdown menu "Line On Map". Initially "All Lines" option is selected. The yearly bar chart on the left will give a general overview of how ridership data in a chosen CTA station changed over the years. On the right side, users can choose between three chart types: daily, monthly, or weekdays. Users also have to select a particular year for which the chart on the right side will be displayed. Users can also see the raw data below each chart.
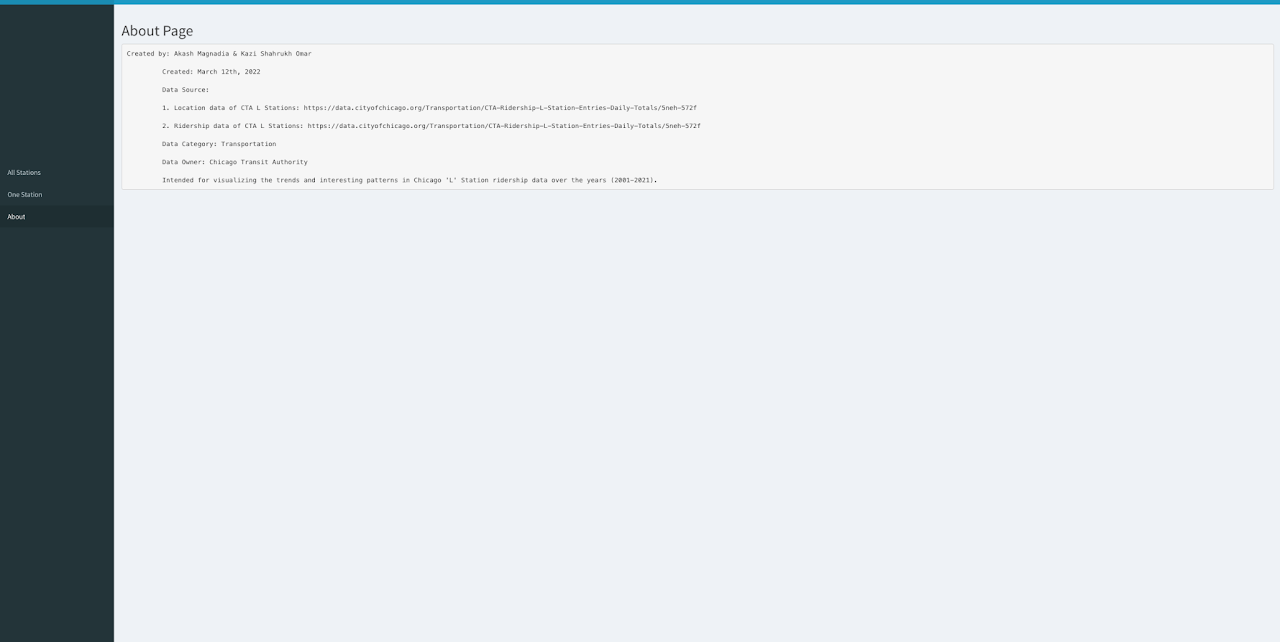
On the About page, some details are listed such as creators of the application, date published, data sources, data owner etc.
About the Data
Data source: Two datasets were used to build the application. Both datasets were collected from Chicago Data Portal.
-
Dataset that contains information about all the CTA L stops including their latitude and longitude can be found at: https://data.cityofchicago.org/Transportation/CTA-System-Information-List-of-L-Stops/8pix-ypme. The file size is 48KB.
-
Ridership data of all the CTA L stations can be found at: https://data.cityofchicago.org/Transportation/CTA-Ridership-L-Station-Entries-Daily-Totals/5neh-572f. The file size is 39MB.
The CTA L stops information data provides location and basic service availability information for each place on the CTA system where a train stops, along with formal station names, stop descriptions, and line colors (RED, BLUE, G (Green), O (Orange), BRN (Brown), P (Purple), Pexp (Purple Express), Y (Yellow), and Pnk (Pink)). DIRECTION_ID refers to the normal direction of train traffic at a platform (E - East, W- West, N - North, S - South). STOP_ID is a unique identifier for each stop and MAP_ID is a unique identifier for each station. ADA column tells if the stop is ADA (American’s with Disability Act) compliant.

The ridership data contains entries of daily rides entries of all the CTA stations in Chicago starting 2001 to 2021. The dataset shows entries at all turnstiles, combined, for each station. Daytypes are as follows: W = Weekday, A = Saturday, U = Sunday/Holiday.
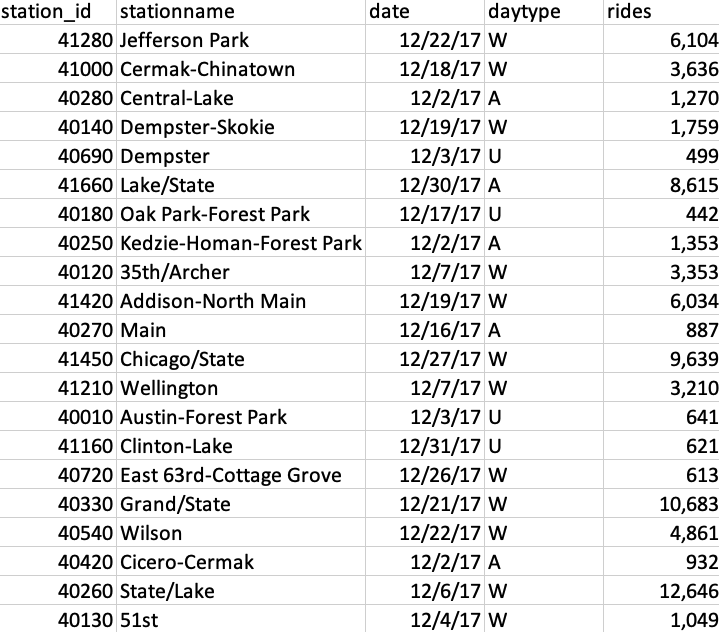
The free web-based version of the Shiny server that was used to publish this project has a limit of 5 MB for each data file. Thus, we split the ridership data file (39 MB) into smaller pieces to be able to upload it. Python script used for splitting the ridership data and creating the TSV files is provided below:
#!/usr/bin/env python3

import csv
import os
import sys

os_path = os.path
csv_writer = csv.writer
sys_exit = sys.exit

if __name__ == '__main__':
   # number of rows per file
   chunk_size = 130000

   # file path to master tsv file
   file_path = "C:/Users/Akash/UIC/CS 424/tsv_splitter/CTA_-_Ridership_-__L__Station_Entries_-_Daily_Totals.tsv"

   if (not os_path.isfile(file_path) or
        not file_path.endswith('.tsv')):
       print('You must input path to .tsv file for splitting.')
       sys_exit()
   file_name = os_path.splitext(file_path)[0]

   with open(file_path, 'r', newline='', encoding='utf-8') as tsv_file:
       chunk_file = None
       writer = None
       counter = 1
       reader = csv.reader(tsv_file, delimiter='\t', quotechar='\'')

       # get header_chunk
       header_chunk = None
       for index, chunk in enumerate(reader):
           header_chunk = chunk
           header_chunk[0] = header_chunk[0][1:]
           break

       for index, chunk in enumerate(reader):
           if index % chunk_size == 0:
               if chunk_file is not None:
                   chunk_file.close()

               chunk_name = '{0}_{1}.tsv'.format(file_name, counter)
               chunk_file = open(chunk_name, 'w', newline='', encoding='utf-8')
               counter += 1
               writer = csv_writer(chunk_file, delimiter='\t', quotechar='\'')
               writer.writerow(header_chunk)
               print('File "{}" complete.'.format(chunk_name))

           chunk[1] = chunk[1].replace("'", "")
           writer.writerow(chunk)
Interesting Findings
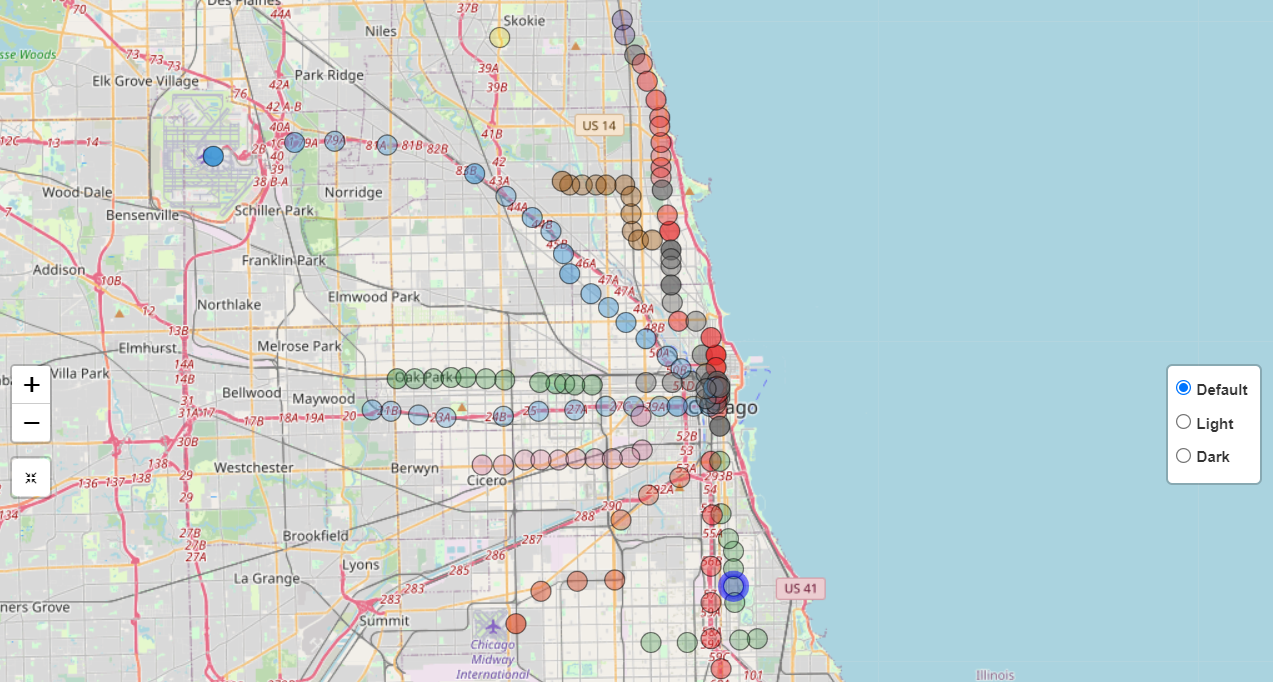
Findings 1: As we look at the data or, the opacity of each station on the map during 2021, it seems that there were more riders on Red Line than any other line. We can also observe that O'Hare station has the most riders of all stations when we look at every line.
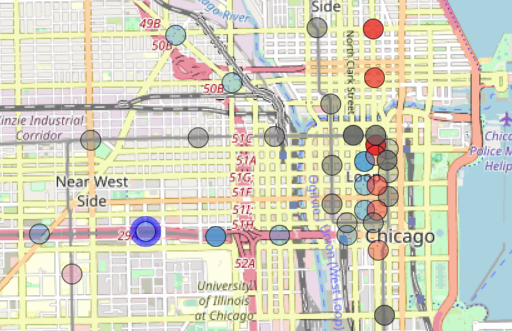
Findings 2: As we zoom in towards the loop, we can see that there are significantly more riders at stations in the loop and more ridership on Red Line stations near the loop. One more interesting observation we can see is that the UIC-Halsted station stands out with darker blue shade as it contains more than usual entries, which can be explained by the fact that about 85% of UIC students commute to the university.
Findings 3: Among all the Red line CTA stations, 95th/Dan Ryan was the busiest during Covid lockdown restrictions. It was also the third busiest CTA station in 2020 (source).
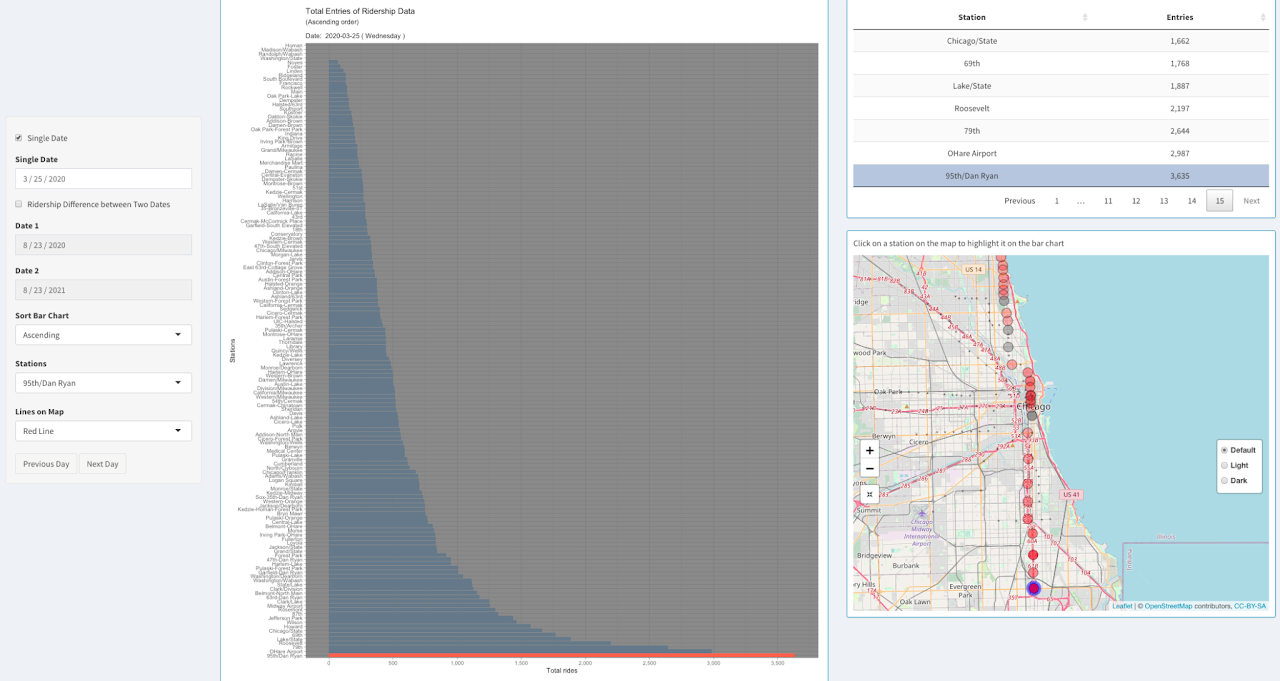
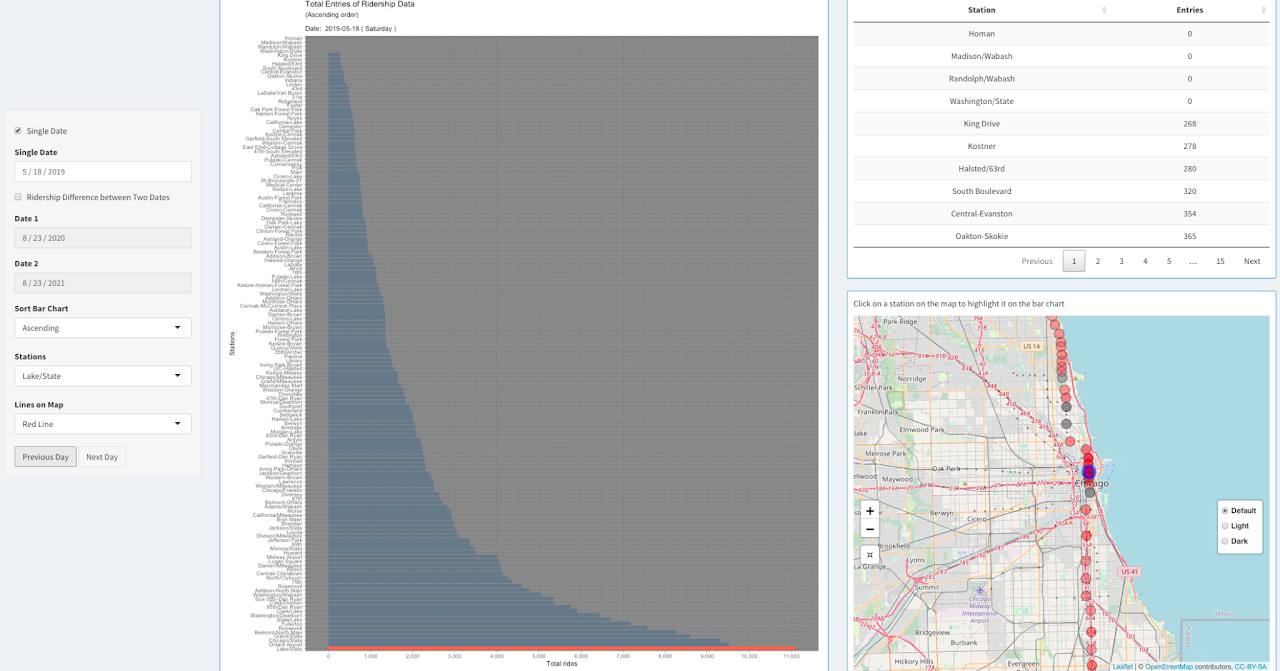
Findings 4: In 2019, Lake/State had an average of 19,364 weekday passenger entries, making it the busiest 'L' station (source). During the Covid restrictions, it lost momentum in ridership. But after the restrictions were removed, it again became the busiest red line staiton.
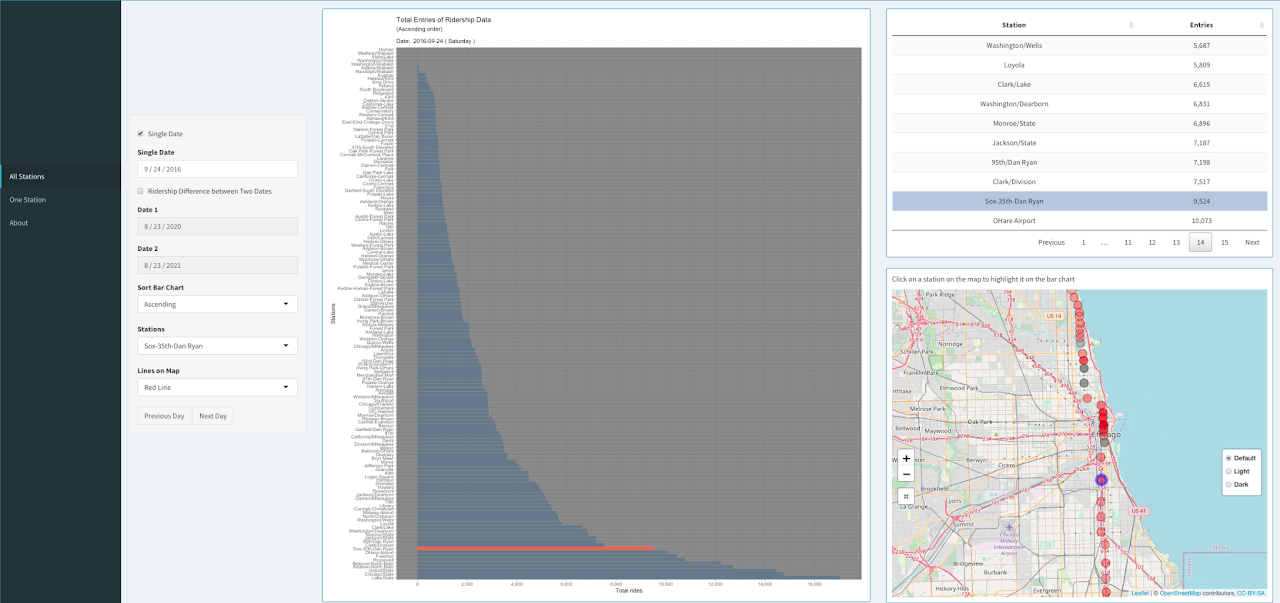
Findings 5: Sox 35th Dan Ryan station usually has less number of riders but during games or concerts at Chicago White Sox statidum the ridership data spikes. On September 24, 2016, Chicago White Sox stadium had a record attendance of 47,754 hosting a concert of Chance the Rapper (source). Thus, we can see that the Sox 35th Dan Ryan station almost had as many entries of ridership as Ohare Airport that day.
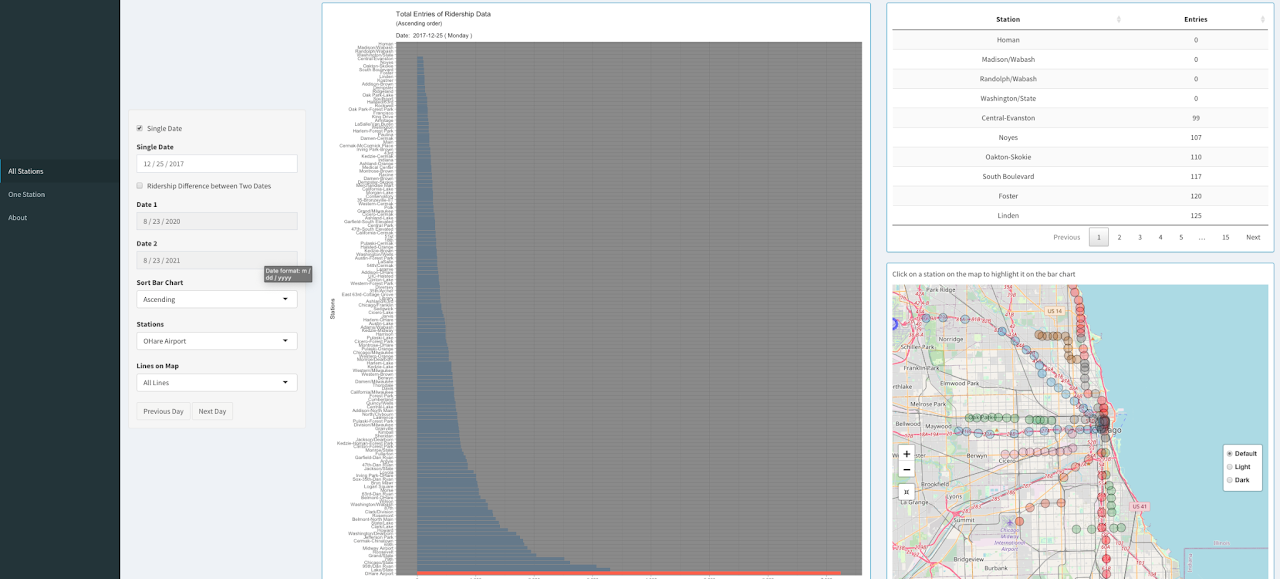
Findings 6: As we can clearly see, most of the CTA stations have very less ridership entries on Christmas day (Dec 25th). However, O'Hare remains busy as numerous people fly to and from Chicago Airports during Christmas (source).
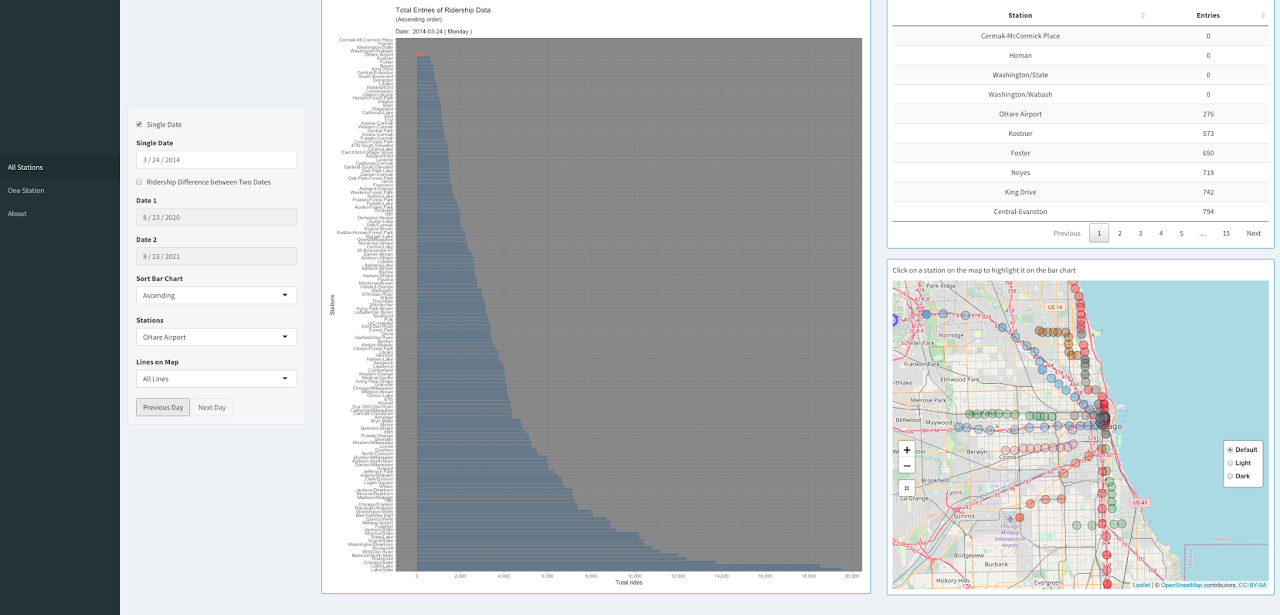
Findings 7: On March 24, 2014 at 2:50 a.m. local time, a CTA passenger train overran the bumper at O'Hare, injuring 34 people. Following the accident, the line between O'Hare and Rosemont was closed, with a replacement bus service in place. We can clearly see from the bar chart, that due to that incident there were almost no ridership entries on OHare station on 24th March and the following week.
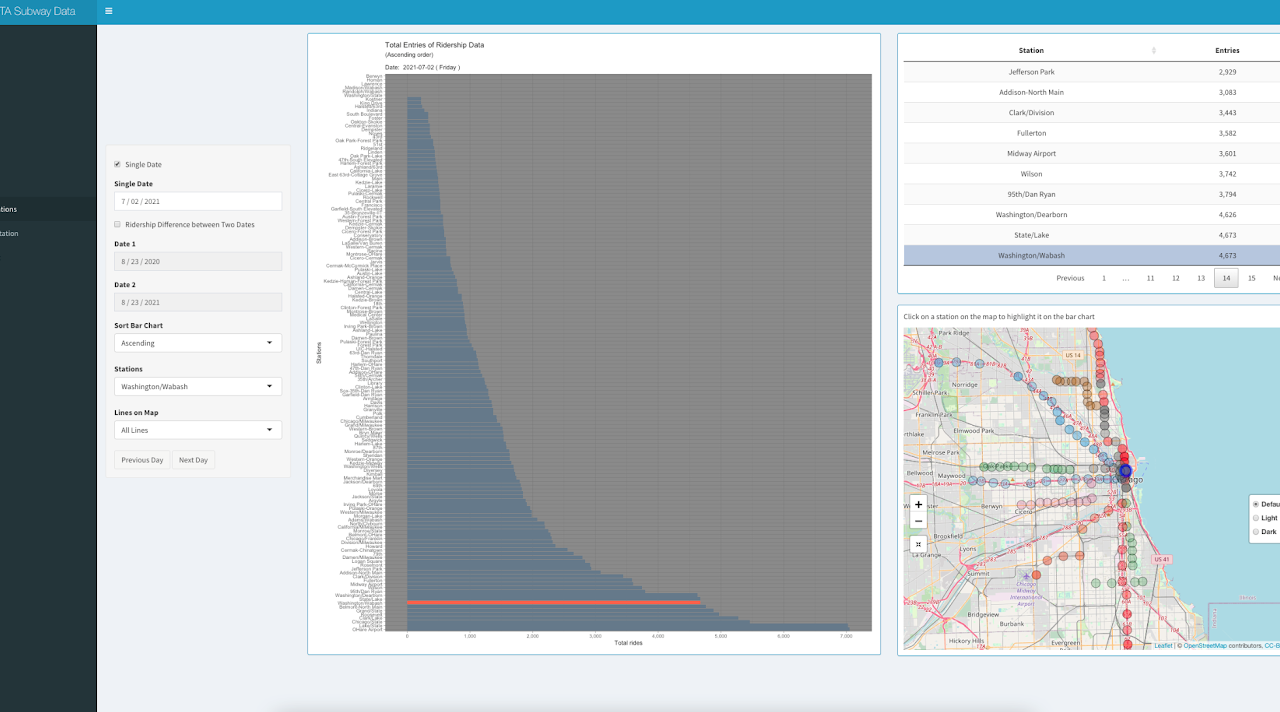
Findings 8: The Grant Park Music Festival is a ten-week (Jul 2 – Aug 21, 2021) classical music concert series held annually in Chicago, Illinois, United States. During this time Washington/Wabash station remains busy as it is the public transport access to Grant Park. Also, the station remains busy as Millennium Park is a very popular destination for visitors.
Setup and Installations
Install R:
Download R from https://www.r-project.org/ (4.1.2). Click “download R”.

You can select the default link https://cloud.r-project.org/.

Download and install a version that match your OS.

Install RStudio:
Download and install RStudio from https://rstudio.com/products/rstudio/.

Download the free version.

Setup the project:
Create a folder in your local machine where you want the project to locate at. Open the terminal and set the direction to the created folder. Run the following command:
git clone https://github.com/komar41/Dont-Sleep-in-the-Subway.git.

Open RStudio. Go to “File” and select “Open Project”.

Choose the project folder (“Dont-Sleep-in-the-Subway”) that you cloned from GitHub.

Open the file “app.R” and press “Run App” button on RStudio.

Rstudio will tell you if you are missing some of the packages. When the pop-up shows up, click “Yes” to install all those packages.

After Installation of those packages, RStudio will start a Shiny app on your local machine.